The Kīlauea Volcano: Be a Volcanologist

Monitoring Hawaiʻi Volcanoes

Download Lesson 1

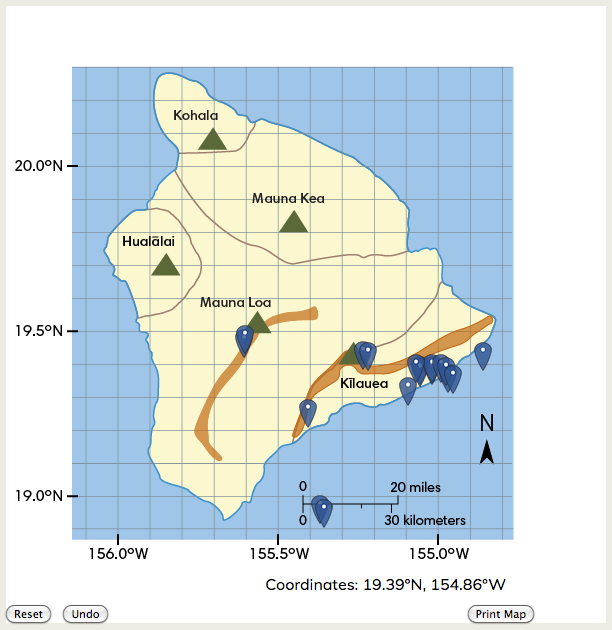
Students take on the role of volcanologists working to keep the public safe on the island of Hawaiʻi. They begin by analyzing geologic data from the days leading up to the May 2018 eruption of Kīlauea. Students use the data to make predictions and recommendations about mitigating the effects of volcanic hazards on the island. Students will continue this process in the next lesson. They will also refer to this information as they create a Hazard Response Plan in the final lesson.

NOTE: This lesson requires some familiarity with basic terms and concepts related to volcanoes. If your class has limited prior knowledge of volcanoes, it is recommended that you complete Lesson 0 before doing this lesson.

GUIDING QUESTION

How do scientists monitor volcanoes in order to predict hazards and keep the public safe?

MATERIALS and PREPARATION

Teacher Materials

Student Materials

Resources

Determine Lessons’ Fit in Curriculum

  1. If you have not done Lesson 0, read through that lesson and determine whether your class needs the introduction to different types of volcanoes and their characteristics. Lesson 1 and the subsequent lessons are designed to provide opportunities for students to analyze and interpret data from a recent hazardous event: the eruption of Kīlauea volcano. The lessons assume students’ knowledge of the features of volcanoes.

Prepare Lesson Materials

  1. Determine which lesson handouts you will need hard copies of, and print enough for your class. Note that the Hawaiʻi Volcanoes Data handout can be accessed online. It is recommended that students work in groups of four if using hard copies and in pairs if using computers. If using hard copies, printing in color is highly recommended to support student analysis.
    • The Volcanology handout can be laminated for re-use.
    • Each student needs a copy of the Observation Journal handout; alternatively, you can create a model of the handout somewhere easily visible, such as on a whiteboard.
  2. Determine whether you will do a live demonstration of a deformation model or show students the Deformation Model Demonstration video to support student learning during the activity. If doing the live demonstration, set it up as follows:
    • Tape the bottom of the box, or line it with a trash bag to prevent leakage.
    • Make a hole on the side of the box near the bottom (to feed the tubing through).
    • Insert one end of the tubing into the balloon and tape it in place. Place the balloon on the bottom of the box and feed the other end of the tubing out through the hole in the side of the box.
    • Tape the tubing down on the bottom of the box.
    • Fill the box with 6 - 8 inches of flour and press and smooth it down.
    • Test out your caldera demonstration model by blowing into the tubing to inflate the balloon, causing deformation, and then letting the air out rapidly to create a caldera. Ensure that you can inflate the balloon and that it has the proper effects. After testing, ensure the balloon is deflated and press down and smooth out the flour again before doing the demonstration.
  3. Prepare a class chart based on the table in the Observation Journal handout for use in the discussion part of the lesson (see page 26).

Prepare the Activity Approach

  1. Determine how you would like to structure the Activity section of this lesson. For example:
    • Have teams self-direct their pacing and decide for themselves which data to analyze first.
    • Give students more structured guidance. Encourage the class to start with the reports from the five volcanoes on the island of Hawaiʻi and then progress to the earthquake data.
    • You might also assign team roles and/or designate different students within the teams to lead the team’s analysis of different pieces of data.
  2. Part of the activity involves plotting coordinate points on a map. If students have not plotted coordinate points on a map before, demonstrate the process. This map shows latitude and longitude lines to the tenth of a degree; students should estimate the placement of points between those lines. Be sure that students understand how to plot points to the hundredth of a degree and recognize that the values of the x-axis decrease from left to right (because they represent coordinates west of the prime meridian; these can also be considered negative coordinates). Note that the coordinates on both axes of the map do not start at 0 because the map shows only the area around the island of Hawaiʻi.
    1. If students have access to a computer or tablet, they can use the interactive map in the Hawaiʻi Volcanoes Online Data. Demonstrate how to find and mark a point on the map. Students can check off each earthquake from the list as they plot it.
    2. If computer access is not available, students can plot the points by hand on the paper map provided in the Hawaiʻi Volcanoes Data handout.

OPENING

Elicit Prior Knowledge

If your class completed Lesson 0, remind them that they prepared for their role as volcanologists by exploring important concepts about volcanoes and classifying them into different categories.

If your class did not complete Lesson 0, ask students questions to engage their prior knowledge of volcanoes, such as:

Introduce the Hawaiian Volcanoes

  1. Show students the Hawaiʻi Volcanoes slideshow. The first image is a map that names some of the volcanoes in the chain of the Hawaiian islands.
    • Explain that some islands were formed by one volcano, while others are made up of two or more.
    • Point out the five volcanoes on the “Big Island” of Hawaiʻi—Kohala, Mauna Loa, Mauna Kea, Hualālai, and Kīlauea—and explain that these are all shield volcanoes.
  2. Then go over the diagram showing the structure and features of a shield volcano. If the class completed Lesson 0, this diagram will be familiar from that lesson.
  3. Next, show the profiles of each volcano in the slideshow. After showing the volcanoes, ask students:

    • Which volcanoes should be closely monitored and why?

    Students might say:

    • Mauna Loa, Hualālai, and Kīlauea because they are all active volcanoes.
    • I think Mauna Kea should also be monitored because it is dormant and it might erupt again.
    • Kīlauea should be monitored very closely because it has been continuously erupting.

    Introduce Working as Volcanologists

    1. Introduce or review the unit Guiding Question:

      How do scientists monitor volcanoes in order to predict hazards and keep the public safe?

    2. Introduce students to their role for this lesson and the following lessons: They will work as volcanologists (scientists who study volcanoes) on the island of Hawaiʻi. As volcanologists, students will interpret scientific information and use it to keep the public safe from volcanic hazards. Set the scene for students as beginning in late April 2018. Give each student a copy of the Observation Journal handout.
    3. Explain that students should use the Observation Journal to:
      • Predict changes in volcanic hazards on the island.
      • Make safety recommendations to the public.
    4. You may want to record these tasks on the board or somewhere else easily visible to students for reference.

ACTIVITY

Introduce the Activity

  1. Organize students into teams of four.
  2. Give each team a copy of the Volcanology handout, which contains important information they can use to help them analyze the volcano data they will receive. If the class completed Lesson 0, they will have already read pages 1–8. If not, they can refer to these pages as needed. Point out the following sections on pages 9–11 that pertain to today’s lesson, and read the topic questions as a class:
    • How and why do scientists monitor deformation at volcanoes?
    • How and why do scientists monitor earthquakes around volcanoes?
    • How and why do scientists monitor sulfur dioxide concentrations around volcanoes?
  3. Also provide each team with access to the Hawaiʻi Volcanoes Data handout (either the print or online version), which includes:
    • A recent report from each of the five volcanoes on Hawaiʻi, including a graph of deformation at Kīlauea
    • A list of the date, time, and location of recent earthquakes on and near the island
    • A map of the island with latitude and longitude lines
    • A map of sulfur dioxide concentration on and near the island
  4. Emphasize that if students run into unfamiliar vocabulary or aren’t sure how to interpret the data in their Hawaiʻi Volcanoes Data handout, they can refer to their Volcanology handout for assistance.
  5. You may want to conduct a quick class brainstorm regarding possible ways to organize the data in their Observation Journal—for example:
    • By date
    • By type of observation (earthquakes, deformation, etc.)
    • By location/area
    Alternatively, suggest one of these methods for all students to use.

Demonstrate Deformation

  1. As teams get started, do the deformation model demonstration (see Lesson Preparation) or show students the Deformation Model Demonstration video in a location where small groups can view it. Call the teams of students, one by one, to observe the demonstration while the rest of the class continues working.
    • Before starting the demonstration, ask students to draw a “Before” picture of the setup.
    • Then blow up the balloon or show that portion of the video. Cover the tubing so that the balloon does not deflate, or pause the video before the deflation is shown. Ask students to draw a “During” picture and share their observations.
    • Finally, allow the balloon to deflate rapidly. (It may help to suck the air out of the balloon through the tubing.) This process should form a caldera in the flour. Ask students to draw a “Final” picture and share their observations.
    • Engage the team in briefly talking about what happened to the land and why.
    • Then ask students to consider how GPS stations (described in their Volcanology handout) can monitor the types of changes they observed. Tell them to imagine two GPS stations set up on opposite sides of the volcano. Ask:
      • How would the distance between the stations change as the volcano inflates? How would it change after the eruption?
    • Briefly create a graph like the example shown to show changes in deformation leading up to and after an eruption. The increase in distance between the stations occurs as inflation pushes the ground outward. After an eruption, the distance rapidly decreases again as the ground sinks back down.
    • You may also opt to show students the Volcano Monitoring: Measuring Deformation and Tilt with GPS animation from IRIS (Incorporated Research Institutions for Seismology).
    • Reset the demonstration before calling up the next team.

Observe, Organize, and Analyze Data

  1. After doing the deformation model demonstration or showing the video, circulate to provide support as teams work together to analyze all of the information in the Hawaiʻi Volcanoes Data handout. Prompt them to refer to the Volcanology handout to help them make sense of new terms and concepts. Also remind students to record their observations, analyses, and recommendations in the Observation Journal.
  2. As students discuss ideas with their teams, remind them to focus on determining whether they anticipate any changes in volcanic activity, and, if so, where. If a team struggles with the process, consider asking questions such as:
    • What patterns do you notice about the earthquake data?
    • What do you notice about the sulfur dioxide data?
    • What do you notice about the deformation data? How does it compare to the deformation demonstration that you observed?
    • How does that information help you make a prediction about volcanic activity on Hawaiʻi?
    • How does the data your team looked at help you identify areas at risk for new volcanic hazards or eruptions?
    As students view the deformation data from Kīlauea, they should notice that the graph shows a sharp increase prior to May 2018. This increase can be interpreted as inflation of the magma reservoir, which often occurs prior to eruption and/or movement of magma. Students’ plotted earthquake data should look like the example shown here:
  3. Note that students using the Hawaiʻi Volcanoes Data handout online can use the Print Map button to generate an image file of their map that they can then print or save to their computer. Students may want to use this image later as part of their final project.
  4. Discuss Data Analysis and Recommendations

    1. Gather the class for discussion.
    2. Have each team take turns sharing a finding they found important, and then ask for input from the rest of the teams: do they agree or disagree?
    3. Begin a chart to keep track of ideas and recommendations from the teams. A completed class chart might resemble the following (note that your class may have chosen to organize their Observation Journal in a different way, such as by date):
    Our Observations Our Analyses Our Recommendations
    Earthquakes
    • A couple of earthquakes occurred on Mauna Loa in March.
    • At the beginning of May there were lots of earthquakes around Kīlauea.
    • Earthquake locations were mostly south and east of the Kīlauea summit.
    The increase in earthquakes in the Kīlauea area might mean Kīlauea is about to erupt.
    • Scientists should watch Kīlauea closely.
    • Scientists should monitor the area southeast of the Kīlauea summit.
    • People who live near Kīlauea should make emergency plans.
    • Scientists should also continue monitoring Mauna Loa.
    Deformation
    • Inflation has been happening at Mauna Loa, but it seems to be slowing down recently.
    • Starting around March 2018, a sharp increase in inflation happened near Puʻu ʻŌʻō at Kīlauea.
    • The sharp increase in inflation might mean Kīlauea is about to erupt.
    • The eruption could happen at Puʻu ʻŌʻō or somewhere nearby in the rift zone.
    • Scientists should watch Kīlauea closely.
    • People who live near Kīlauea—and especially in the rift zone—should make emergency plans.
    Sulfur dioxide
    • The concentration of sulfur dioxide around Kīlauea increased between April 3rd and May 3rd.
    • Magma is probably getting near the surface.
    • The increase in sulfur dioxide might mean Kīlauea is about to erupt.
    • Scientists should watch Kīlauea closely.
    • Anyone who has problems with breathing should leave the area.

    Keep the chart for review and reference in the following lessons.

    Decide on a Plan

    1. Review the teams’ recommendations on the class chart.
    2. Show students the following options, and have them vote on what they think is the best course of action at this point. Students may select more than one option.
      • Evacuate the entire island
      • Closely monitor the area around Mauna Loa
      • Closely monitor the area around Hualālai
      • Closely monitor the area around Kīlauea
      • Evacuate the area around Kīlauea
      • Issue an alert for the area around Kīlauea
    3. After each vote, call on students to provide reasoning for their selection. If students disagree, allow them to respectfully challenge each other’s reasoning. For example, students might say:
      • I think scientists should closely monitor the area around Kīlauea and issue an alert for that area. The warning signs were all happening there, but not around the other volcanoes.
      • I think scientists should also monitor the area around Mauna Loa. Even though there weren’t as many warning signs there, it is still an active volcano.
      • I think the entire island should be evacuated, just to be safe.
      • I don’t think the entire island should be evacuated because it would be difficult, and it would affect a lot of people. I think they should just evacuate the area around Kīlauea.
      • I don’t think people should be evacuated yet. Kīlauea has already been erupting for a long time, and they didn’t need to evacuate the whole area. They just closed areas where the lava was flowing. They should just issue an alert and watch the area closely.

REFLECTION

Summarize

  1. After completing the class chart, review some of the main points that students made. For example, you might say:
    • Our class noticed a lot of earthquakes in the area near Kīlauea to the south and east. We also observed sudden inflation of the land around Puʻu ʻŌʻō and an increase in sulfur dioxide around Kīlauea. Based on these observations, we recommended that the Kīlauea area should be monitored closely and residents should be prepared to leave the area, because these warning signs all indicate that a new eruption could happen soon.
  2. Explain that volcanologists can use a volcano’s past eruptive history to document zones where hazards might be the greatest in a future eruption.
    • Display the Hawaiʻi Lava Flow Hazard Map visual, which illustrates areas of increasing relative severity of lava-flow hazards, designated “9” through “1.”
    • Note that the gray shaded areas show land covered by flows erupted in the past two centuries from three of Hawaiʻi’s five volcanoes.
    • Call on students to point out where Kīlauea past flows have been, and where the highest severity of hazard is near that volcano.
  3. Explain that scientists work with emergency management organizations at the national, state, and local level to issue warnings and alerts about natural hazards such as volcanic eruptions. Point out that analyzing scientific data, as students did in today’s lesson, does not necessarily tell us exactly how people should act or respond. However, it does help us make informed decisions.
  4. Show students the United States Geological Survey (USGS) Volcano Hazards Program website. Explain that this government website provides citizens with information about how scientists help keep the public safe.
  5. Congratulate students for their work interpreting geologic data in order to keep the public safe.