Students continue playing the role of volcanologists on the island of Hawaiʻi. They analyze new geologic data (including maps, photos, and graphs) from the first few days of the May 2018 eruption of Kīlauea in order to predict the occurrence and effects of volcanic hazards and make safety recommendations to the public.

How do scientists monitor volcanoes in order to predict hazards and keep the public safe?
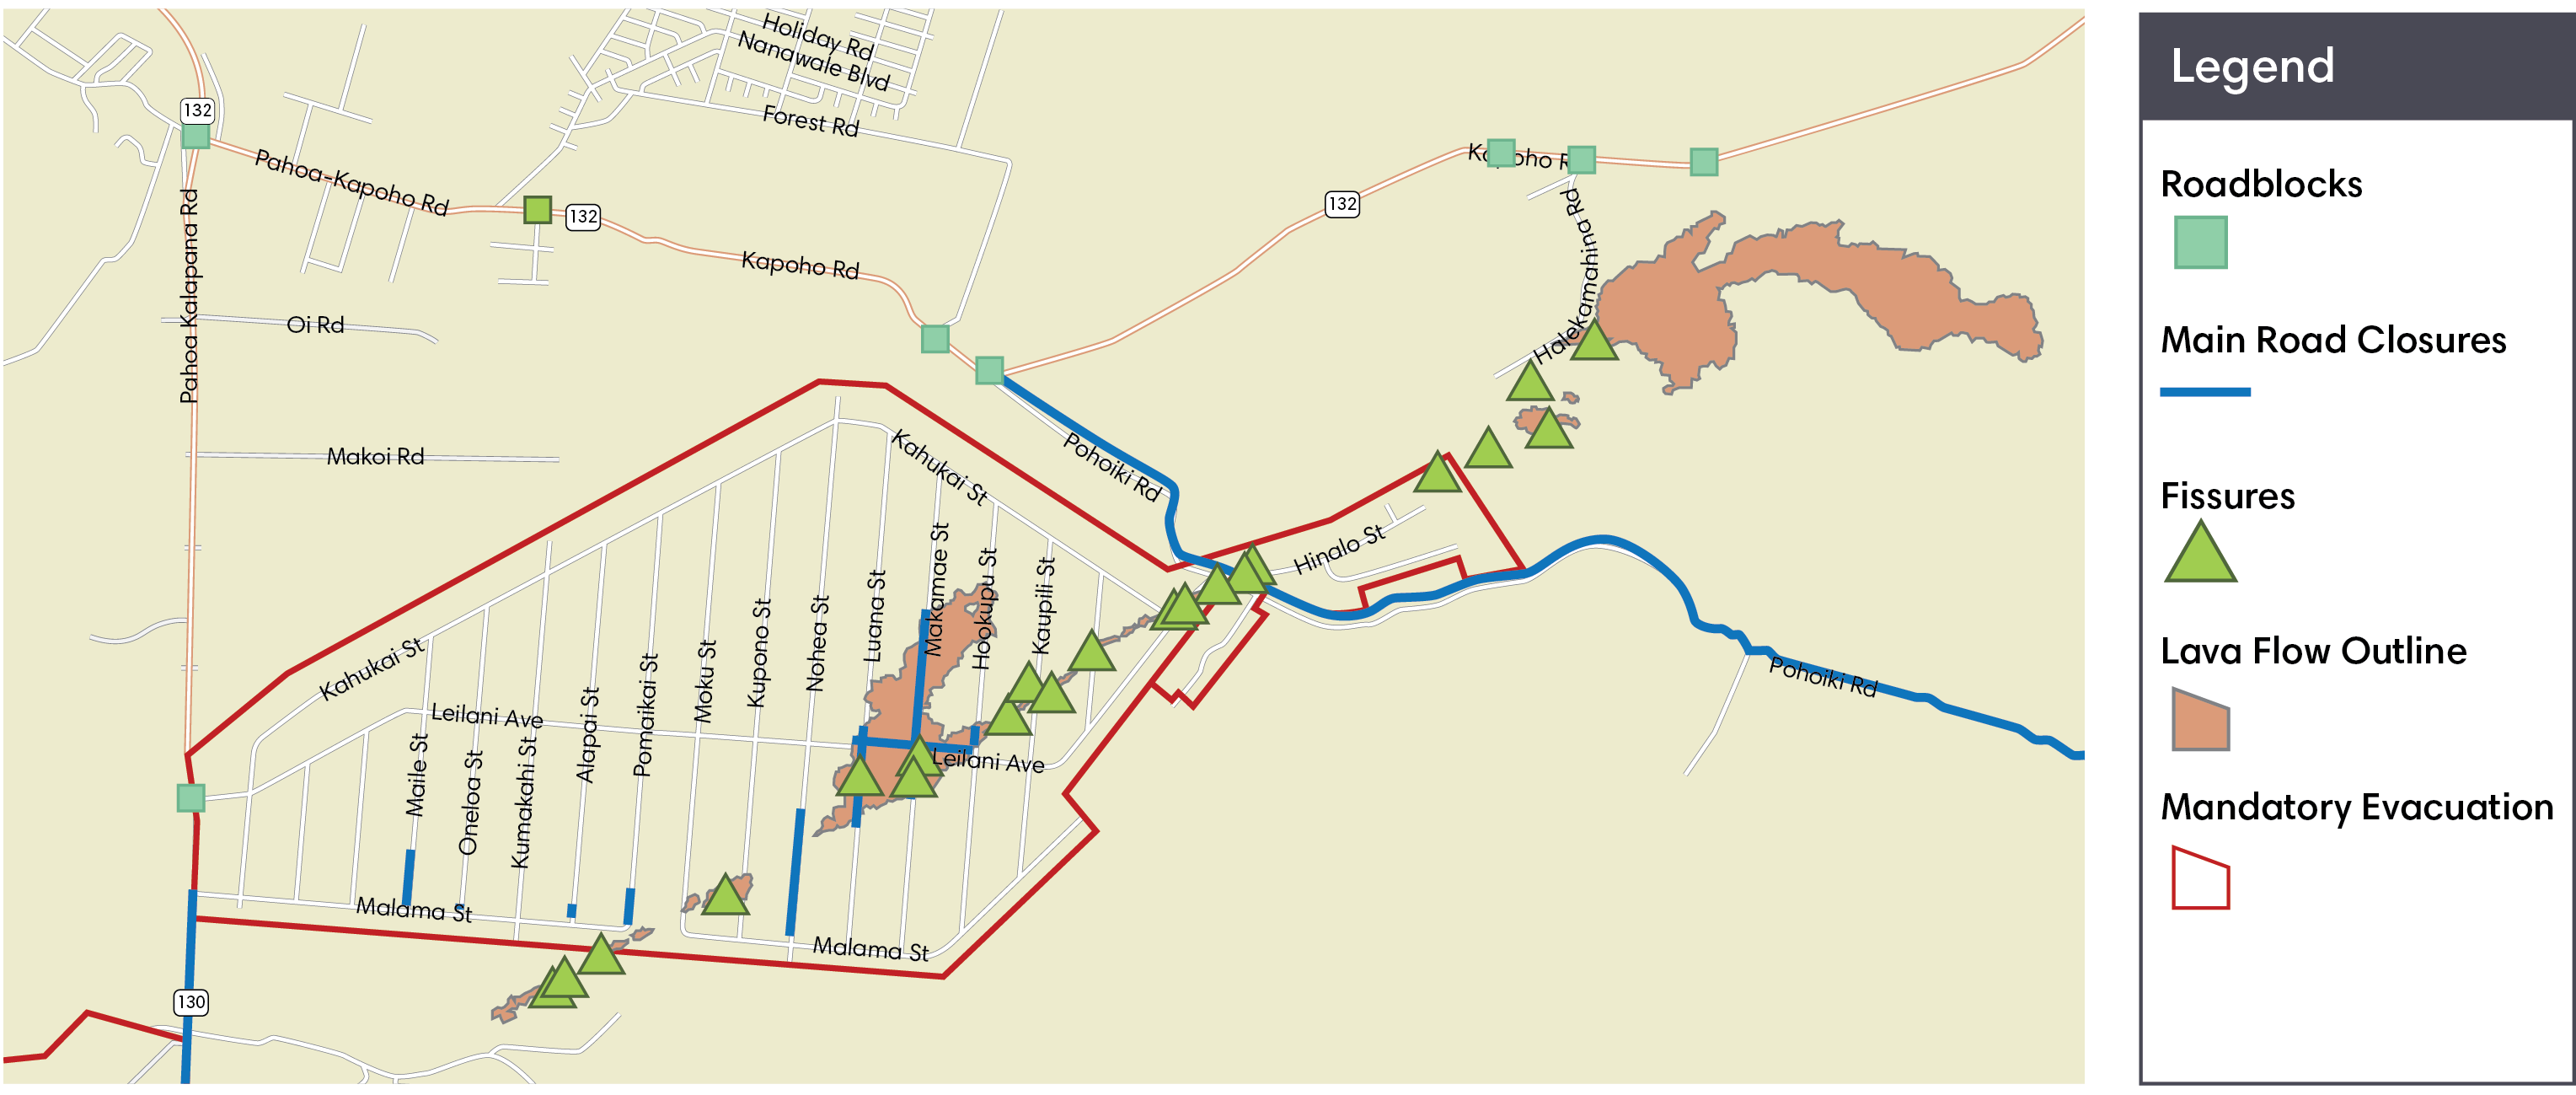
On May 3, 2018, a new eruption of Kīlauea Volcano began in the Leilani Estates neighborhood located in the lower East Rift Zone. Lava, hot water vapor, and gas fumes started spewing into the air from a newly-opened crack in the earth, and lava flowed slowly outward about 10 meters from this fissure.

How do scientists monitor volcanoes in order to predict hazards and keep the public safe?
| Our Observations | Our Analysis | Our Recommendations |
|---|---|---|
Lava flow
|
|
|
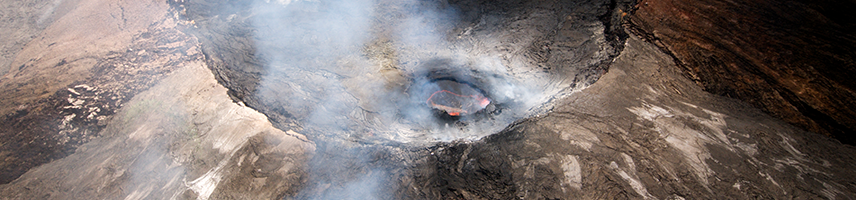
Summit lava lake
|
|
|